AWS Bedrock AgentCore Observability - Pydantic AI + CloudWatch OTEL
By Fabio Douek
Jump to section
Explain (TLDR) like I am...
Imagine your robot helper goes on little adventures. After each one, it drops breadcrumbs: where it went, who it talked to, what took a long time. AgentCore Observability is like a big map on the wall where all those breadcrumbs get pinned.
Grown-ups look at the map to see which steps were slow or got stuck, so they can fix things without waking the robot up and asking it questions. Before, you needed a bulky helper truck to carry the breadcrumbs over. Now the map just takes them straight from the robot, which means less gear and fewer moving parts to babysit.
Think of this as a telemetry pipeline that keeps agent trace and metric data inside the AWS account boundary. No third-party processor sits in the path, authentication is handled through IAM via SigV4, and the data never leaves the tenant.
Due diligence questions to raise: where do traces land (X-Ray and CloudWatch Logs), what is the retention and indexing policy, and which team approves the sampling rate that governs cost exposure. The GenAI semantic conventions are still in "Development" status, so attribute names may shift, which is a version-management risk worth logging.
Treat this as a diagnostic framework for agents that are slow, flaky, or quietly burning tokens. The instrumentation emits structured spans for every model call and tool invocation, so you can localise the failure: a slow tool, a retry loop, an inflated prompt.
The evidence base is new but the mechanism is standard OpenTelemetry, so the findings are portable. Side effect to monitor: 1 percent default sampling hides rare failures, and X-Ray indexing costs rise with volume. Good candidates are teams running Pydantic AI on Bedrock; less suitable for teams outside the five preview regions.
Notice the relief that arrives when a team stops guessing why their agent "felt slow last Tuesday". A shared trace view takes the detective work off one person's plate, and the conversation shifts from blame to evidence.
The new friction is subtle: three different console sections for traces, trace maps, and metrics, which can feel fragmented until people learn the paths. Budget a small amount of group time to agree on how the team will use it, otherwise the map exists but nobody is reading it together.
Think of this stack as a click track for your agent. Pydantic AI keeps the beat with one line of instrumentation, the OTLP exporters carry the signal, and CloudWatch is the mixing desk where every model call and tool hit shows up as its own track.
The feel improved when AWS dropped the collector sidecar: fewer pedals in the signal chain, less latency between what the agent plays and what you hear back. It locks in cleanly with the rest of the AWS ensemble, and the tempo of debugging picks up once the waterfall view is on screen.
The story is time-to-value on agent observability. One line of Pydantic AI instrumentation plus a short SigV4 setup, and traces, metrics, and a service map land in CloudWatch the same afternoon. No collector sidecar, no extra vendor, no data leaving the account.
The positioning writes itself for AWS-native teams: agent telemetry that respects the existing compliance boundary, priced inside the CloudWatch bill they already pay. Strong angle for a launch post aimed at platform and SRE leads tired of stitching observability across three tools.
Overview
I was halfway through writing this blog post when AWS pulled the rug out from under my draft. The original version walked through sending OpenTelemetry data from a Pydantic AI agent to CloudWatch using ADOT (AWS Distro for OpenTelemetry), AWS’s official OpenTelemetry distribution that bundles auto-instrumentation, SigV4 authentication, and a wrapper command you have to run your code through. It worked. It was also 40 lines of environment variables and a dependency tree I did not want to explain.
Then, on April 2, Amazon announced native OpenTelemetry metrics support in CloudWatch. Native OTLP endpoints. Direct ingestion. No conversion logic, no collector sidecars, no distro. My draft went from “here is how to wrestle with ADOT” to “wait, none of this is necessary anymore.” So I scrapped it and started over. You are reading the better version.
With CloudWatch accepting OTLP directly, all you need is SigV4 signing on the standard OpenTelemetry exporters. The requests-auth-aws-sigv4 package does exactly that in a few lines. Combine it with Pydantic AI’s built-in Agent.instrument_all() and Bedrock AgentCore Observability, and you get full agent tracing in CloudWatch with minimal code and zero heavyweight dependencies.
The complete sample code is on GitHub. Clone it, configure your AWS credentials, and run it.
Setup
AWS prerequisites
Before writing any agent code, you need CloudWatch Transaction Search enabled. This is a one-time setup per AWS account that allows CloudWatch to receive and index OpenTelemetry traces.
# Create resource policy for X-Ray to write to CloudWatch Logs
aws logs put-resource-policy \
  --policy-name TransactionSearchPolicy \
  --policy-document '{
    "Version": "2012-10-17",
    "Statement": [{
      "Sid": "TransactionSearchXRayAccess",
      "Effect": "Allow",
      "Principal": {"Service": "xray.amazonaws.com"},
      "Action": "logs:PutLogEvents",
      "Resource": [
        "arn:aws:logs:*:*:log-group:aws/spans:*",
        "arn:aws:logs:*:*:log-group:/aws/application-signals/data:*"
      ]
    }]
  }'

# Route trace segments to CloudWatch Logs
aws xray update-trace-segment-destination --destination CloudWatchLogs
One gotcha worth calling out: only 1% of spans are indexed as trace summaries for free. For development and testing, bump this to 100%:
aws xray update-indexing-rule --name "Default" \
  --rule '{"Probabilistic": {"DesiredSamplingPercentage": 100}}'
For production, keep it lower to manage costs. X-Ray indexing charges add up.
You also need Bedrock model access enabled for Claude in your AWS account. Navigate to the Bedrock console, go to Model access, and enable the Claude model you plan to use.
Project setup
git clone https://github.com/fabiodouek/my2centsai-blog-samples.git
cd my2centsai-blog-samples/bedrock-agentcore-otel-pydantic

python -m venv .venv
source .venv/bin/activate
pip install -r requirements.txt
The dependencies are minimal:
pydantic-ai-slim[bedrock]
opentelemetry-api
opentelemetry-sdk
opentelemetry-exporter-otlp-proto-http
requests-auth-aws-sigv4
The requests-auth-aws-sigv4 package handles SigV4 signing for the CloudWatch OTLP endpoints. No heavyweight distro, no wrapper commands.
Building the agent
The agent itself is straightforward Pydantic AI. The key line is at the top:
from pydantic_ai import Agent, InstrumentationSettings

Agent.instrument_all(InstrumentationSettings(version=5))
The InstrumentationSettings(version=5) parameter opts into the latest instrumentation schema version. This single call enables OpenTelemetry instrumentation for every agent you create afterward. It emits spans following the OpenTelemetry GenAI semantic conventions: gen_ai.operation.name, gen_ai.request.model, gen_ai.usage.input_tokens, gen_ai.usage.output_tokens, and more.
The agent uses BedrockConverseModel with Claude Sonnet:
agent = Agent(
    "bedrock:us.anthropic.claude-sonnet-4-6",
    system_prompt=(
        "You are a helpful assistant with access to weather, math, and time tools. "
        "Use the appropriate tool to answer the user's question. Be concise."
    ),
)
I added three tools to exercise the tool call tracing: get_weather returns hardcoded weather data, calculate evaluates math expressions, and get_current_time returns the current time in a given UTC offset. All self-contained with no external API dependencies so the sample stays portable.
OTel configuration
CloudWatch’s OTLP endpoints require SigV4 authentication. The standard OTLPSpanExporter and OTLPMetricExporter accept a session= parameter for a requests.Session. The requests-auth-aws-sigv4 package adds SigV4 signing to any session. Connecting these two facts gives you a clean setup:
import os

import requests
from requests_auth_aws_sigv4 import AWSSigV4
from opentelemetry import trace, metrics
from opentelemetry.sdk.trace import TracerProvider
from opentelemetry.sdk.trace.export import BatchSpanProcessor
from opentelemetry.sdk.resources import Resource
from opentelemetry.exporter.otlp.proto.http.trace_exporter import OTLPSpanExporter
from opentelemetry.sdk.metrics import MeterProvider
from opentelemetry.sdk.metrics.export import PeriodicExportingMetricReader
from opentelemetry.exporter.otlp.proto.http.metric_exporter import OTLPMetricExporter

region = os.environ.get("AWS_DEFAULT_REGION", "us-east-1")
service_name = os.environ.get("OTEL_SERVICE_NAME", "pydantic-ai-agent-demo")

resource = Resource.create({"service.name": service_name})

# Traces: SigV4-signed session for the X-Ray OTLP endpoint
trace_session = requests.Session()
trace_session.auth = AWSSigV4("xray", region=region)

trace_exporter = OTLPSpanExporter(
    endpoint=f"https://xray.{region}.amazonaws.com/v1/traces",
    session=trace_session,
)
tracer_provider = TracerProvider(resource=resource)
tracer_provider.add_span_processor(BatchSpanProcessor(trace_exporter))
trace.set_tracer_provider(tracer_provider)

# Metrics: SigV4-signed session for the CloudWatch OTLP endpoint
metric_session = requests.Session()
metric_session.auth = AWSSigV4("monitoring", region=region)

metric_exporter = OTLPMetricExporter(
    endpoint=f"https://monitoring.{region}.amazonaws.com/v1/metrics",
    session=metric_session,
)
metric_reader = PeriodicExportingMetricReader(metric_exporter)
meter_provider = MeterProvider(resource=resource, metric_readers=[metric_reader])
metrics.set_meter_provider(meter_provider)
CloudWatch OTLP endpoints are HTTP 1.1 only. gRPC is not supported.
Running it
set -a && source .env && set +a
python main.py
The setup_otel() function in main.py configures the providers at import time, Agent.instrument_all() hooks into them, and the standard OTLP exporters handle the rest. Terminal output shows the agent responses, and behind the scenes OTel spans are being batched and exported to CloudWatch.
The output shows the agent handling multi-tool calls and returning structured results:
============================================================
Prompt: What's the weather like in Seattle and what's 15% of 340?
============================================================

Response: Here are your answers:

- **Seattle Weather:** It's cloudy and 58°F (14°C) with 72% humidity
  and light rain expected. Don't forget an umbrella!
- **15% of 340:** = **51**
Usage: RunUsage(input_tokens=1839, output_tokens=165, requests=2, tool_calls=2)

============================================================
Prompt: What time is it in UTC-8 right now?
============================================================

Response: The current time in **UTC-8** is **11:32 AM** on April 3, 2026.
Usage: RunUsage(input_tokens=1724, output_tokens=89, requests=2, tool_calls=1)
Notice the RunUsage output: two requests and two tool calls for the first prompt (weather + math), one tool call for the second. These map directly to the spans you will see in CloudWatch.
Testing
What shows up in CloudWatch
One thing that tripped me up: traces and metrics land in different places in the AWS Console. Traces show up under X-Ray traces > Transaction Search. The service topology lives under CloudWatch > Application Signals (APM) > Trace Map. OTLP metrics go to CloudWatch Metrics under a custom namespace. There is no single unified view. You will be jumping between three different console sections to see the full picture of your agent’s behavior.
After running the agent, traces appear in CloudWatch within a few minutes. Navigate to X-Ray traces > Transaction Search and filter by service = pydantic-ai-agent-demo.
Each agent run produces a trace with a clear span hierarchy:
- Agent run span (top level): the full
agent.run()call- Model request span: each LLM API call to Bedrock, with attributes like
gen_ai.request.model,gen_ai.usage.input_tokens,gen_ai.usage.output_tokens- Tool call spans: each tool invocation, with
gen_ai.tool.nameand the tool result
- Tool call spans: each tool invocation, with
- Model request span: each LLM API call to Bedrock, with attributes like
This hierarchy is what Pydantic AI’s instrument_all() provides. Without it, you would only see raw HTTP calls to Bedrock, losing the agent-level context entirely.
Metrics
Navigate to CloudWatch > Application Signals (APM) > Trace Map to see a visual topology of your agent’s service interactions. The trace map shows the request flow from client through the agent run to Bedrock, with success rates and latency at each hop.
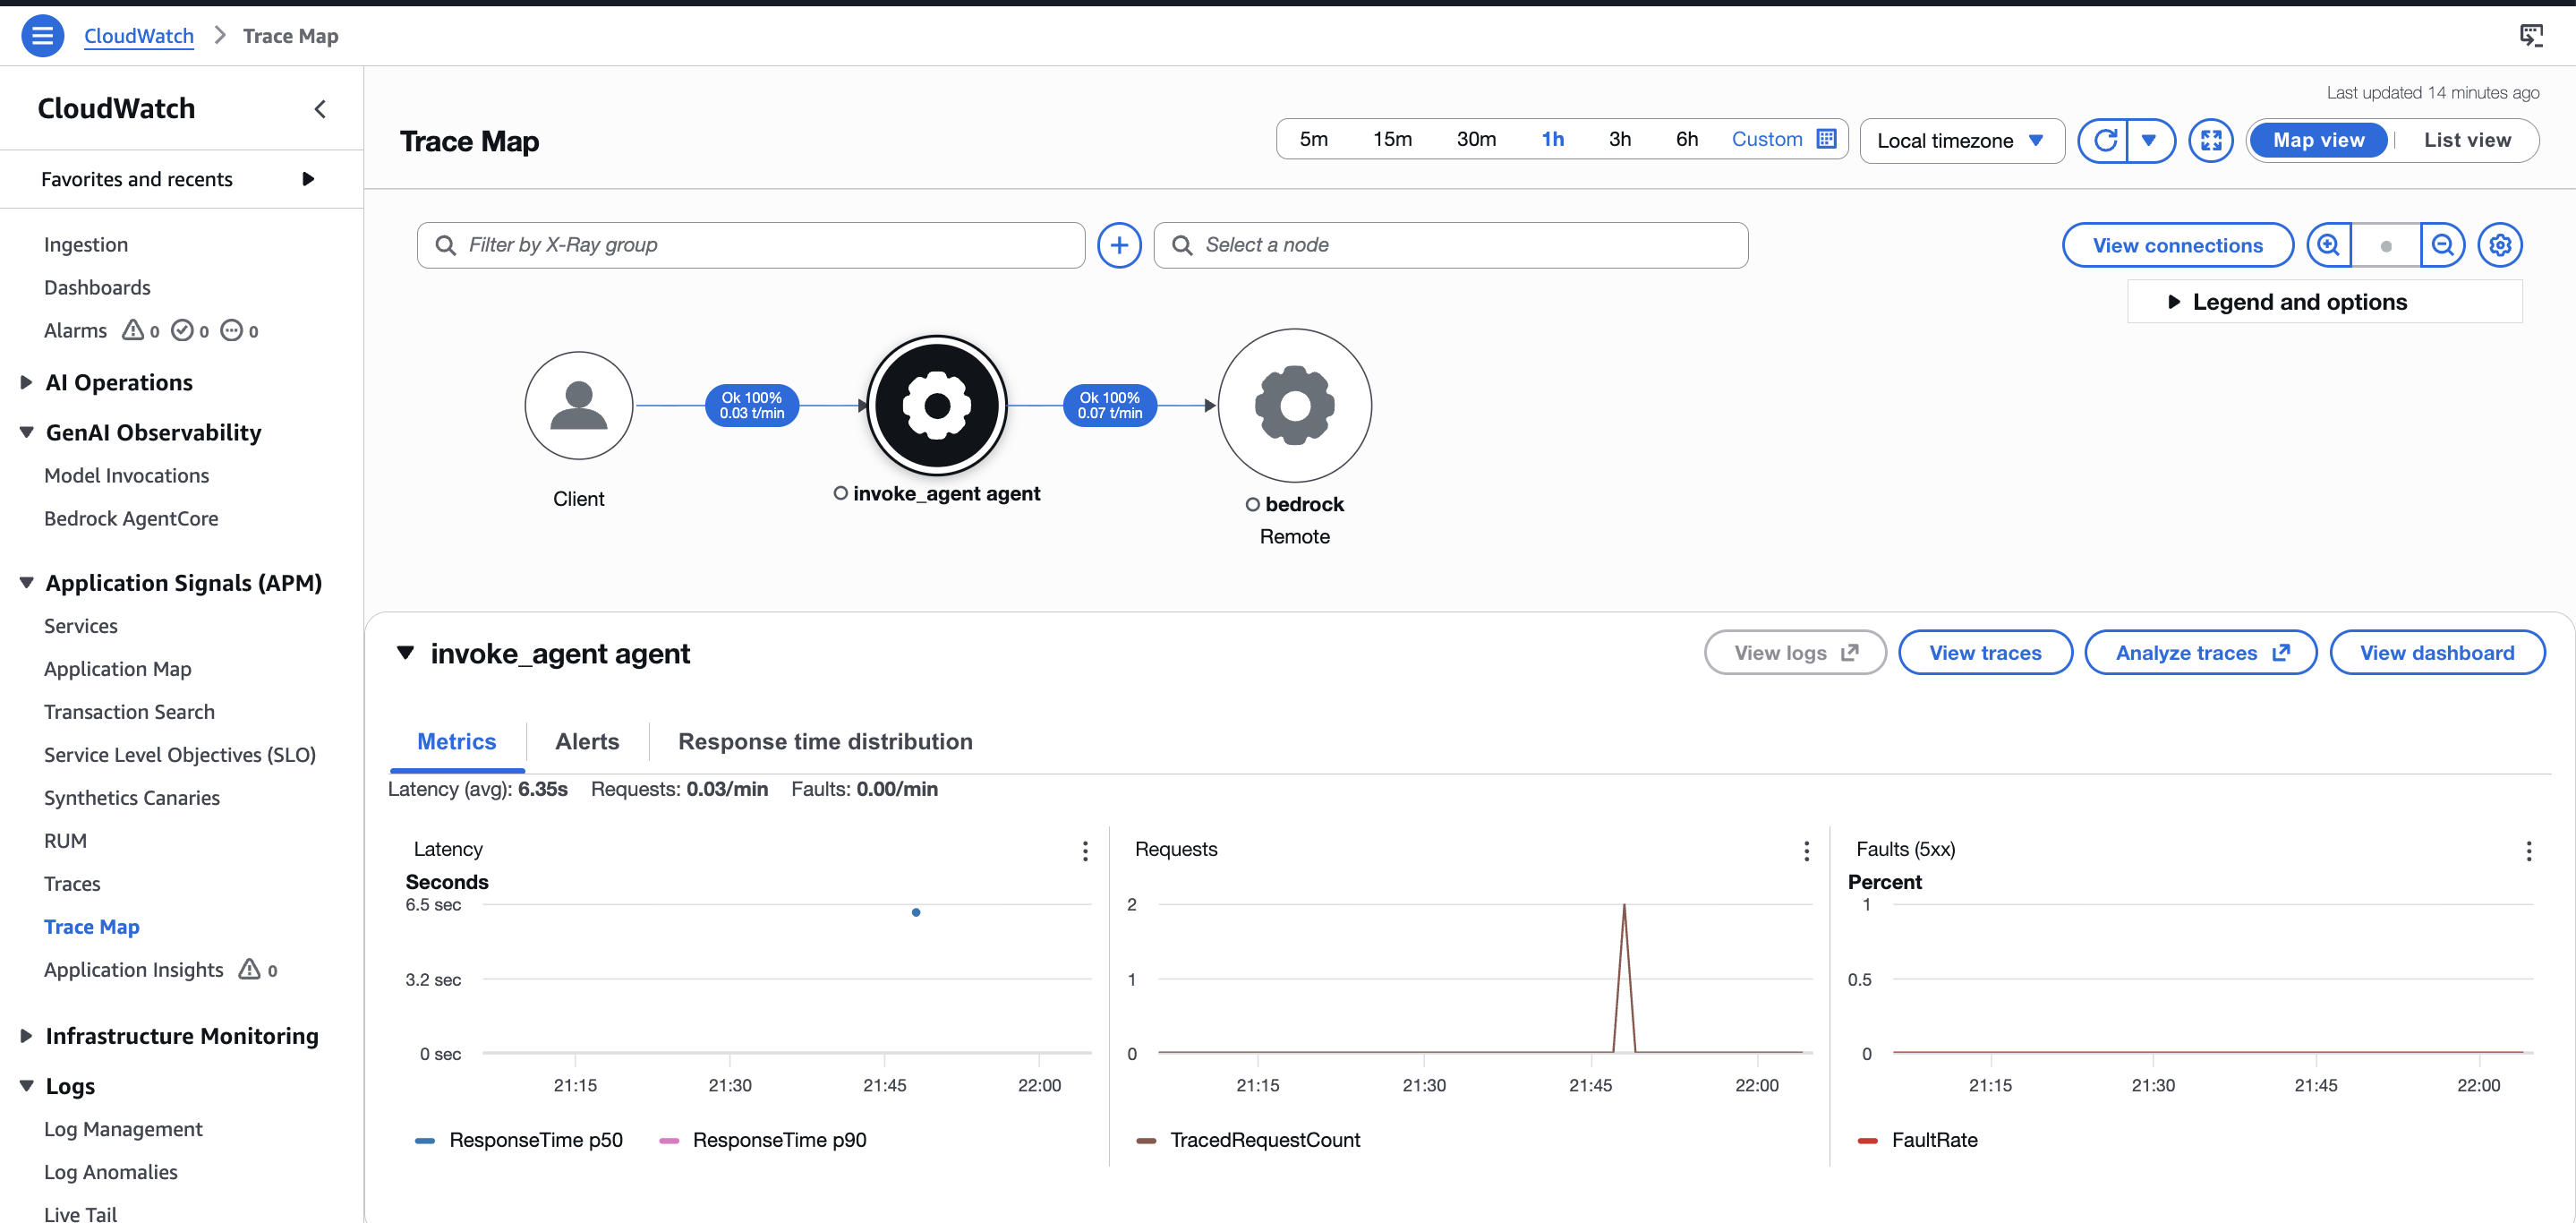
With CloudWatch’s new native OTLP metrics support, Pydantic AI’s gen_ai.client.token.usage histogram and operation.cost histogram can flow directly to CloudWatch Metrics. Worth setting up now since OTel metrics and querying are free during the preview.
Traces
Navigate to CloudWatch > Transaction Search and filter by service = pydantic-ai-agent-demo to see individual spans. Each trace contains the full span hierarchy: agent run, model request (chat us.anthropic.claude-sonnet-4-6), and tool execution spans, all correlated under a single trace ID.
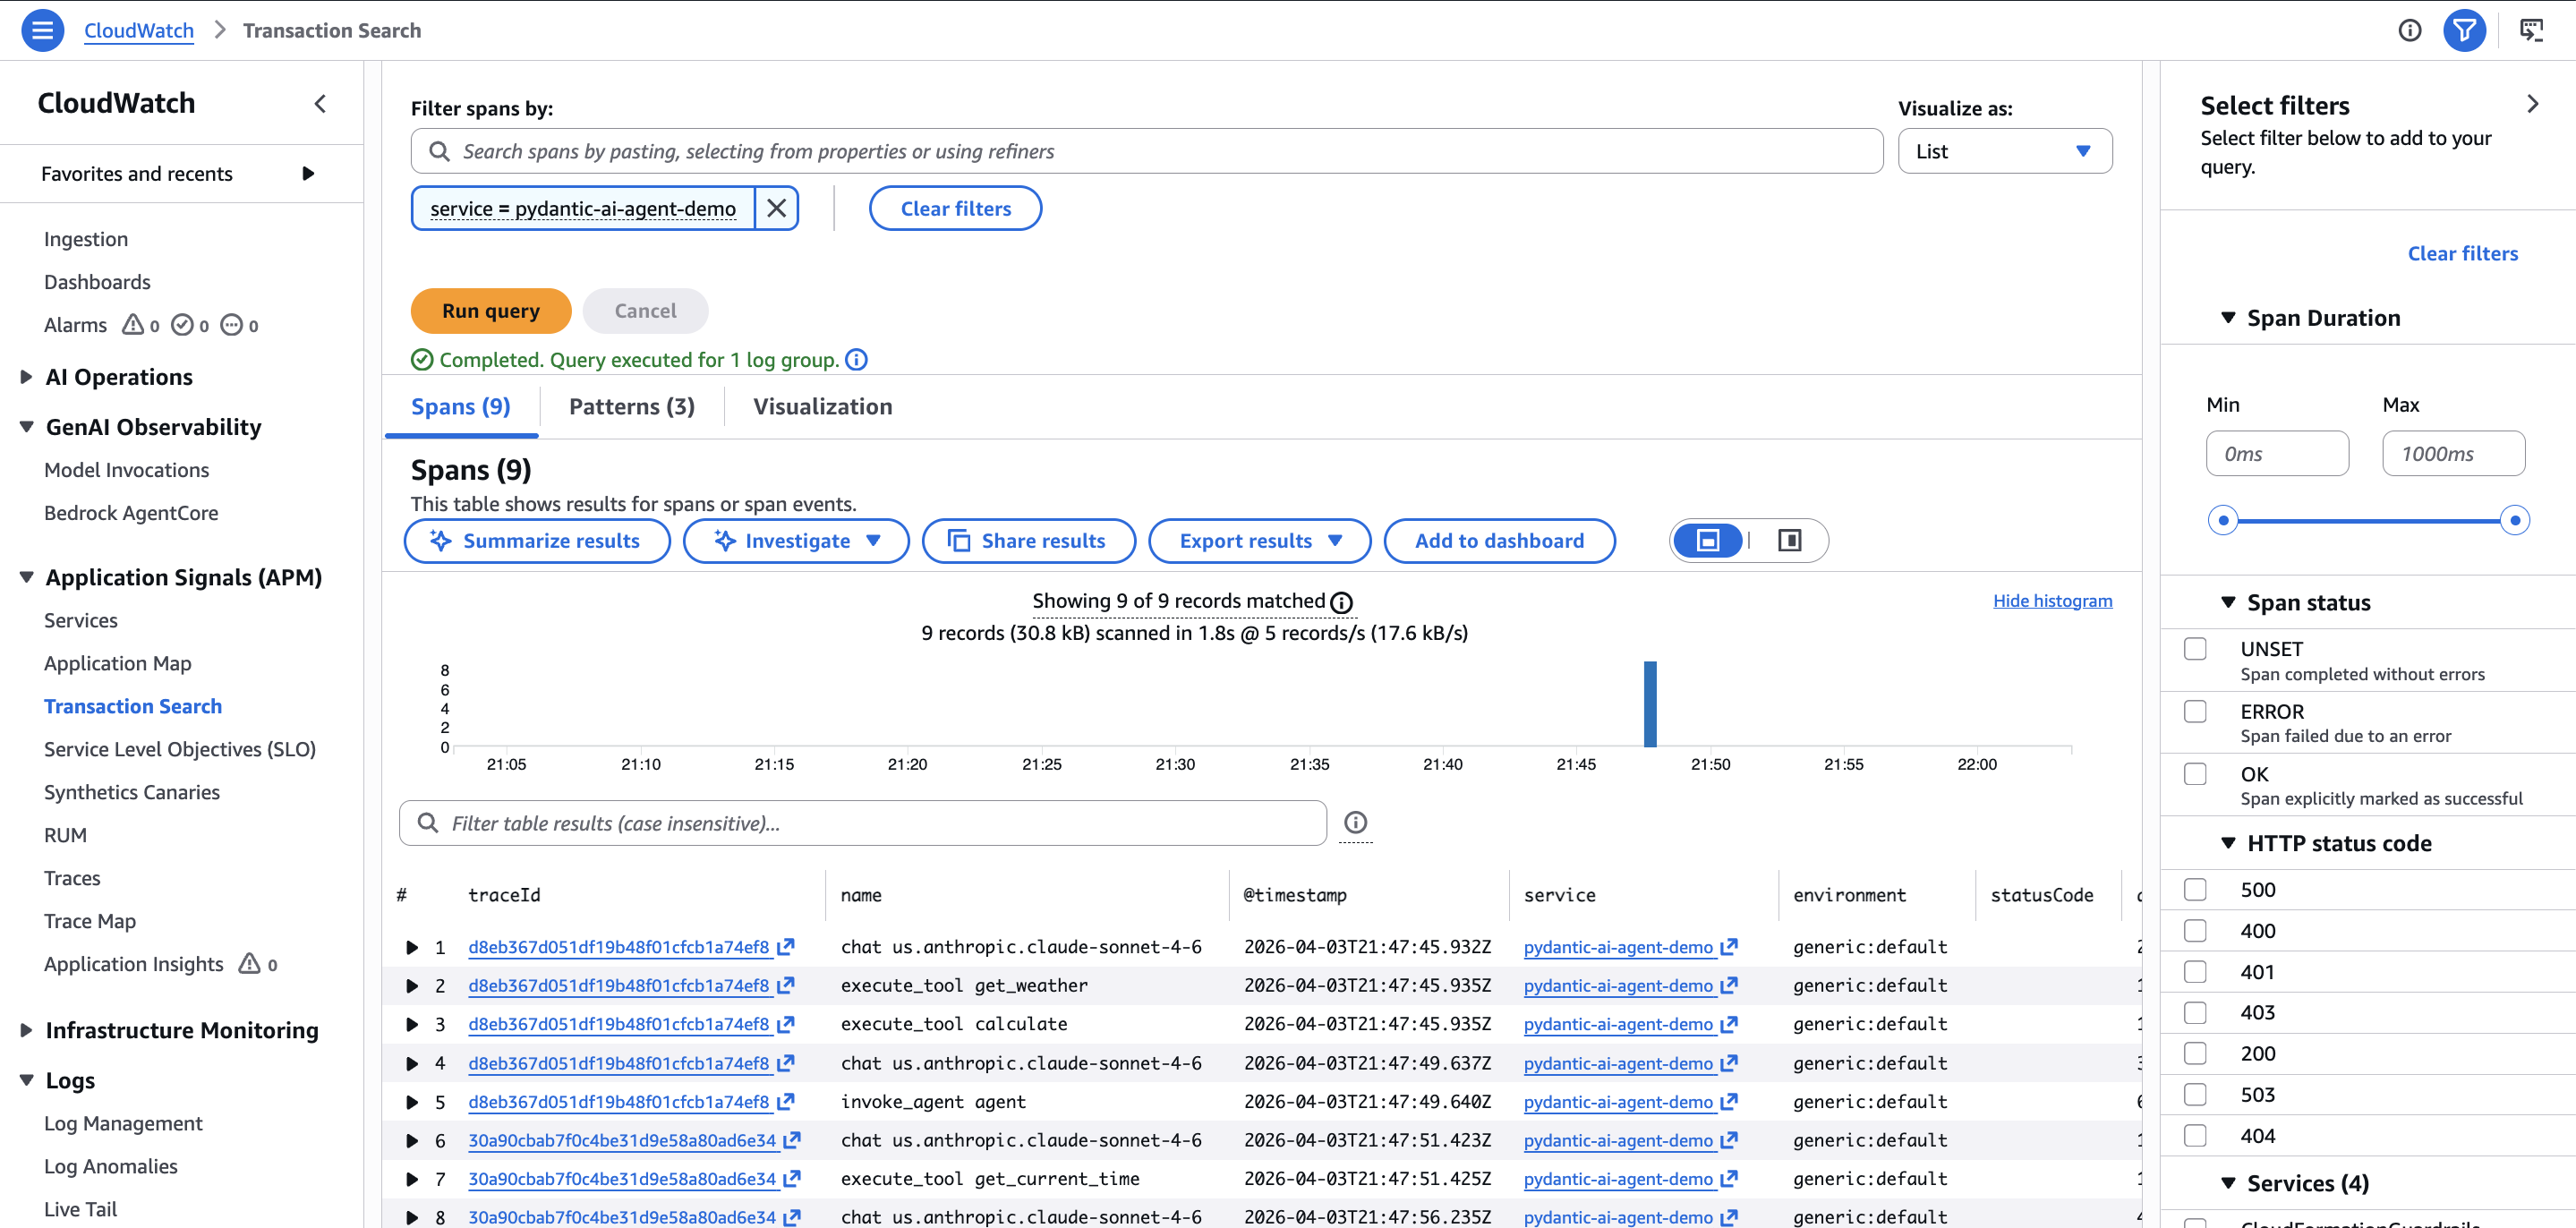
The span list shows exactly what you would expect from the terminal output: two chat spans for the two Bedrock requests, two execute_tool spans for the weather and math tool calls, and a top-level agent run span tying it all together. Duration and status code are visible at a glance.
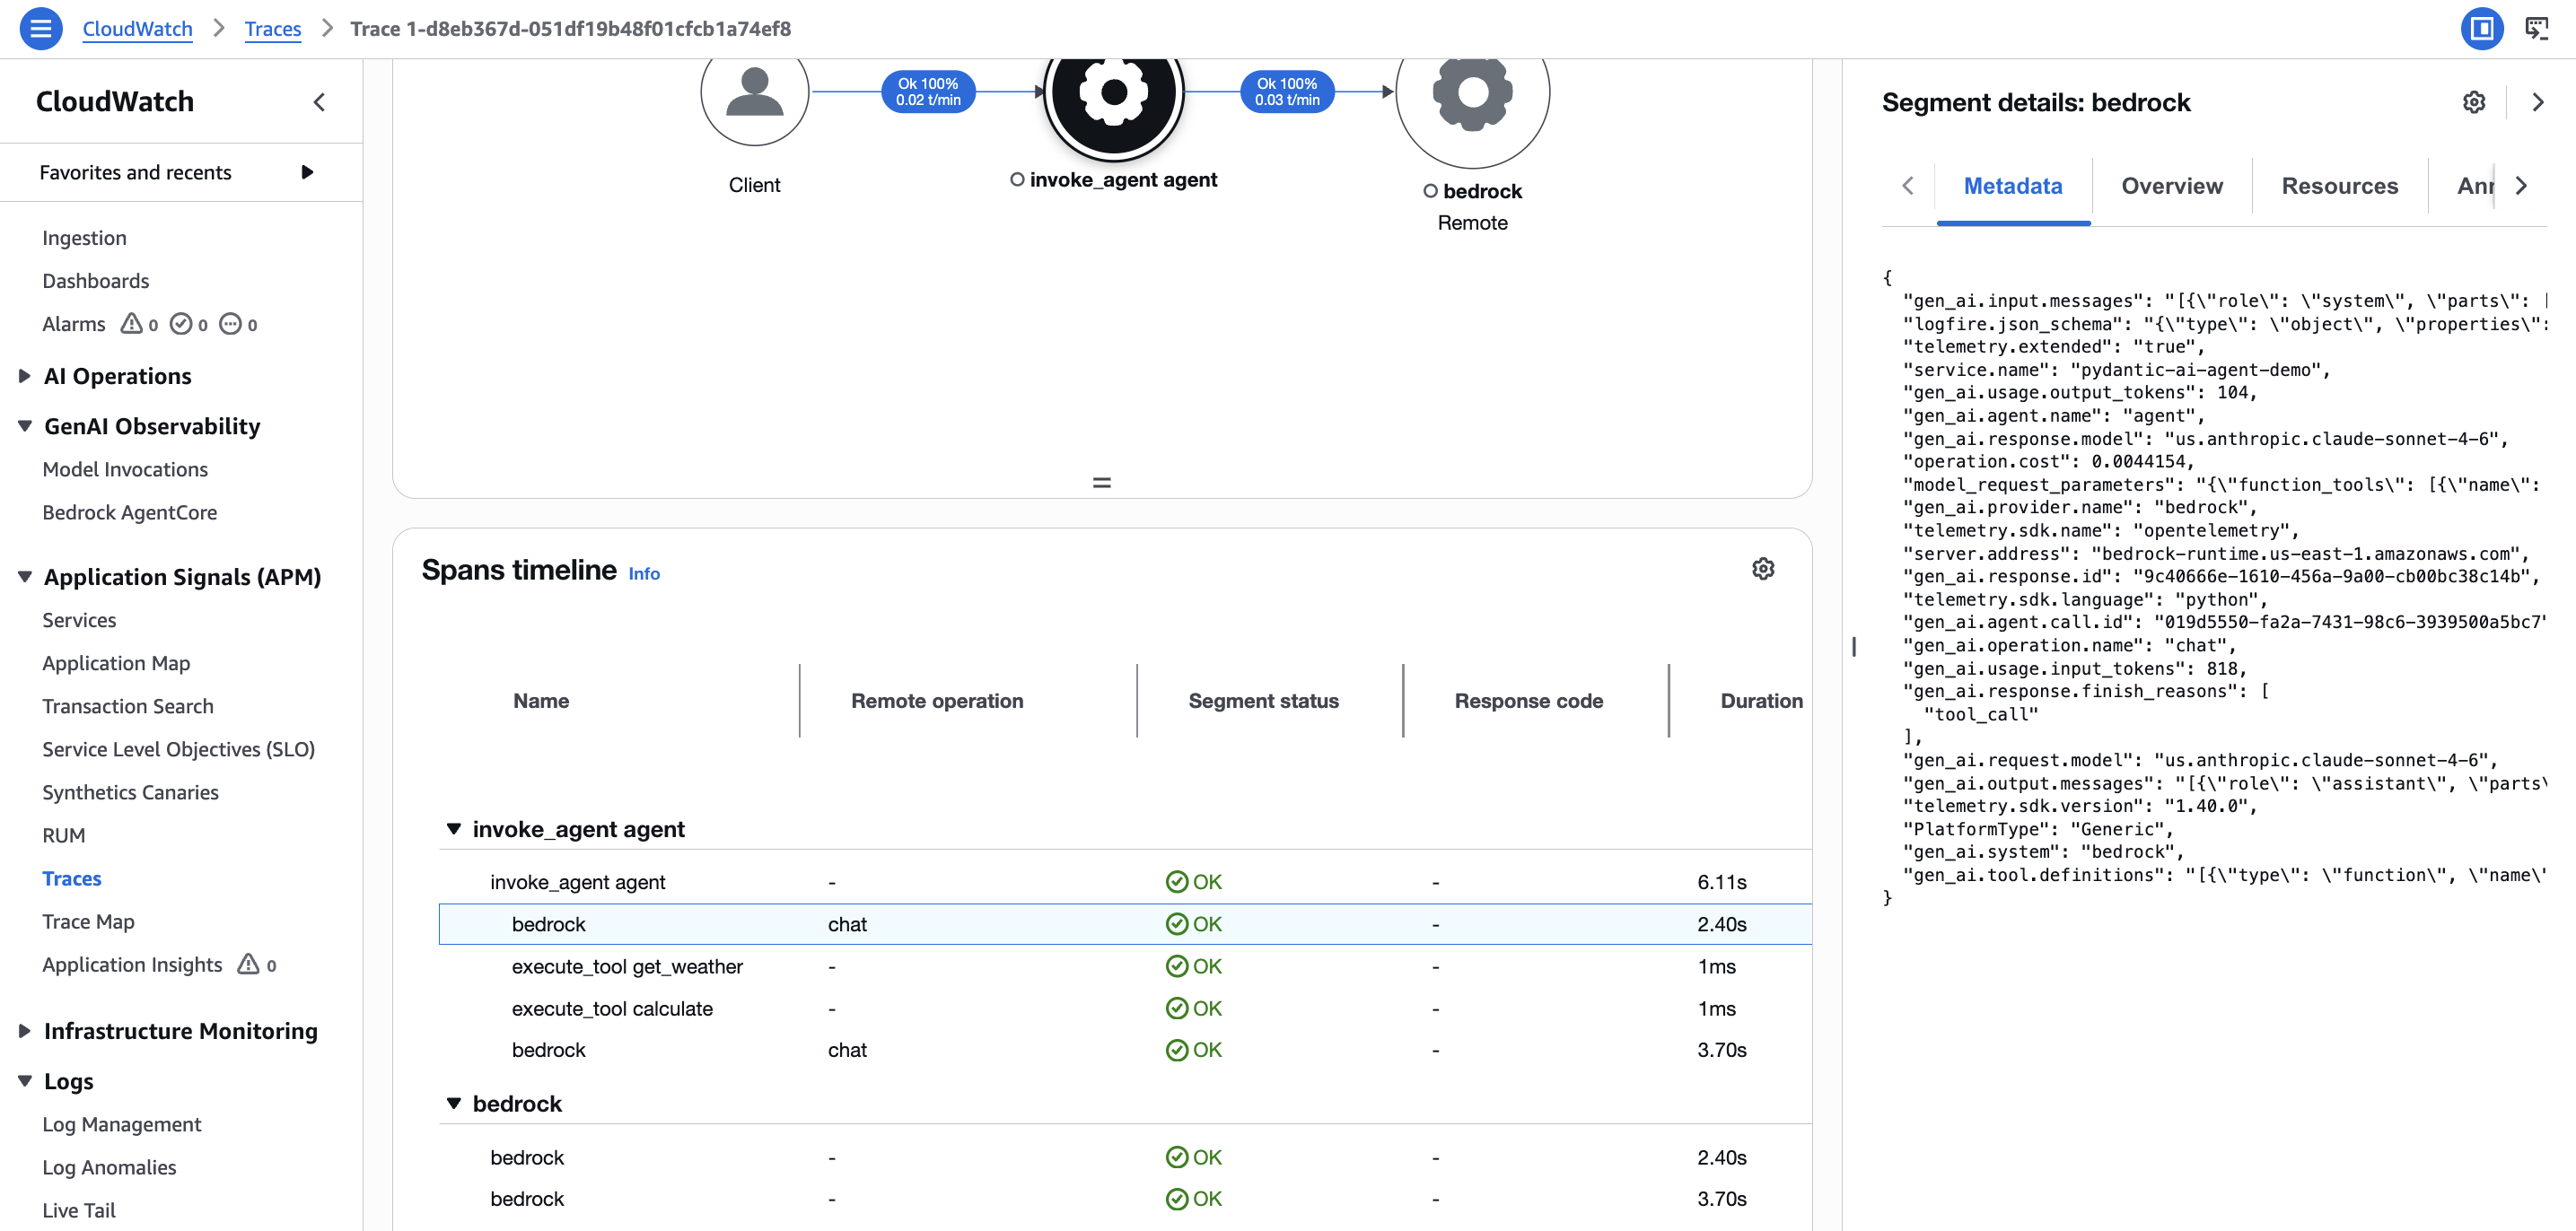
Clicking into a trace opens the span timeline under CloudWatch > Traces, where you can see the full waterfall: agent run, model requests to Bedrock, and individual tool executions with their durations. The segment details panel on the right shows the raw span attributes including gen_ai.request.model and token counts.
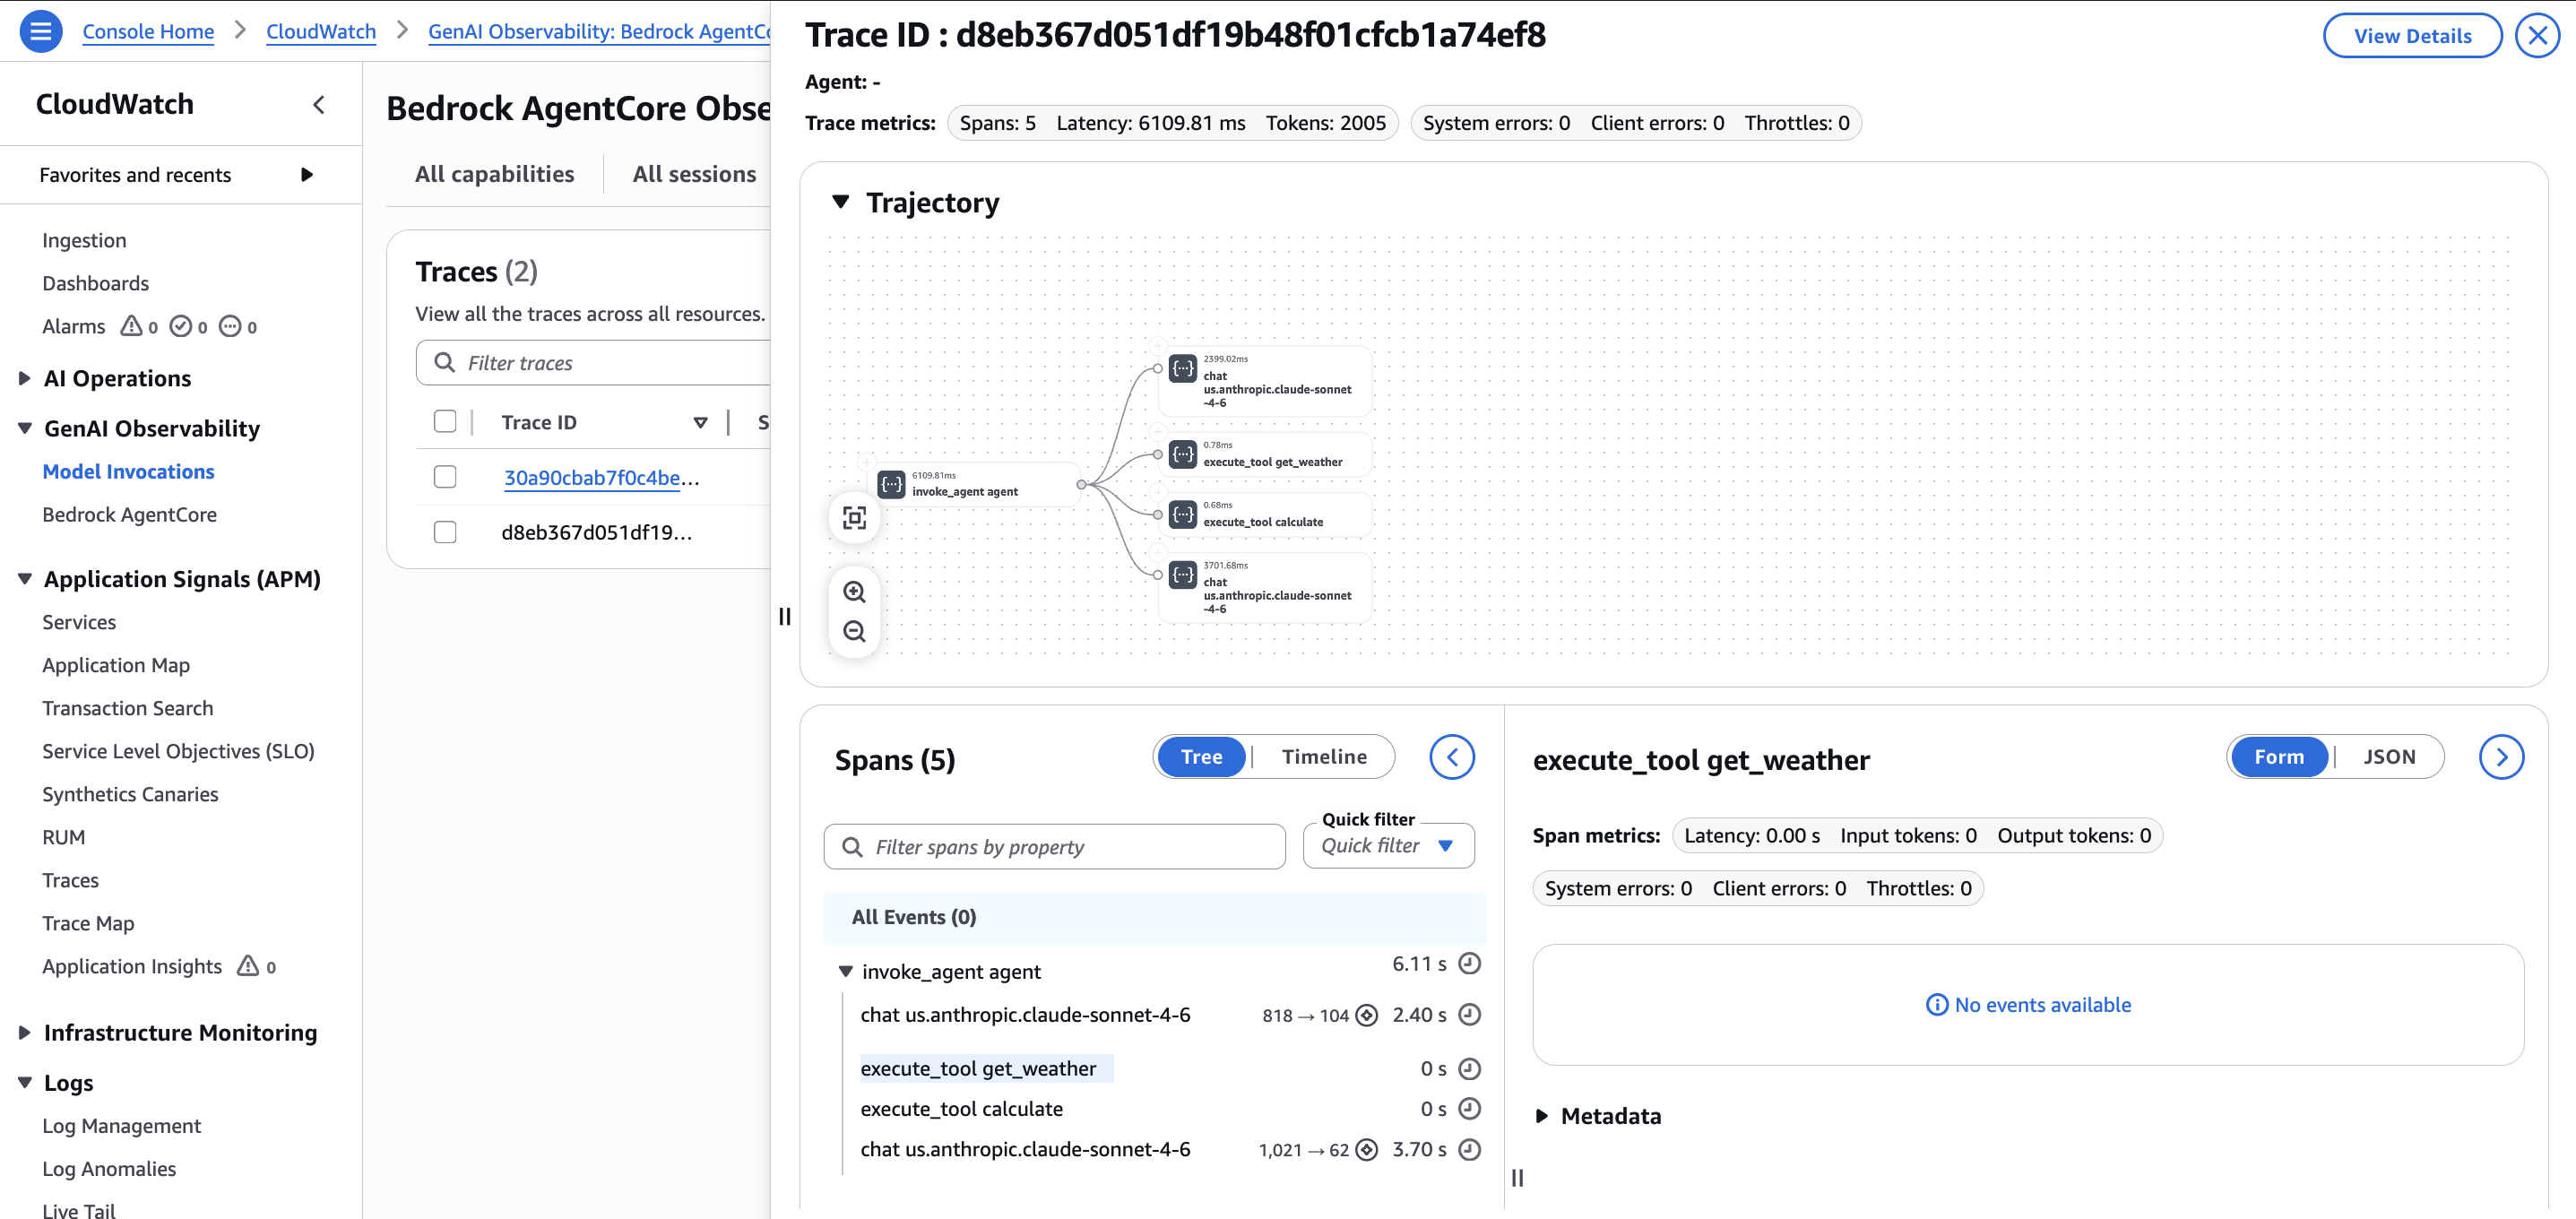
There is also a dedicated view under GenAI Observability > Bedrock AgentCore that shows traces with a trajectory visualization. This view is purpose-built for agent debugging: it renders the call graph visually and lets you click into individual spans like execute_tool get_weather to inspect metadata. This is yet another place in the console where trace data surfaces, reinforcing the point that you will be navigating between several sections.
Gotchas I encountered
The preview is limited to 5 regions. US East (N. Virginia), US West (Oregon), Asia Pacific (Sydney and Singapore), and Europe (Ireland). If your Bedrock endpoint is in a different region, the OTLP metrics export may not work.
GenAI semantic conventions are experimental. The gen_ai.* span attributes Pydantic AI emits follow the OpenTelemetry GenAI semantic conventions, which are in “Development” status with no published timeline for stability. Attribute names may change in future releases. The good news: the OTel foundation means you can update instrumentation without changing your observability backend.
How it compares to alternatives
This is not the only way to observe AI agents. Logfire from Pydantic is the natural choice for Pydantic AI projects. It has native integration and costs $2 per million spans, compared to variable CloudWatch pricing that charges across multiple dimensions (log ingestion, storage, scanning, metrics, alarms). Logfire also provides full-stack observability, so when a database call fails inside your agent, you see both the LLM trace and the database error in one view.
Langfuse is the most popular open-source option with 24,000+ GitHub stars.
CloudWatch’s advantage is zero additional vendors. If you are already on AWS, there is no extra SaaS account, no data leaving your account boundary, and no separate bill. IAM handles authentication. You get infrastructure metrics and AI agent metrics in the same console. For regulated industries where telemetry data must stay within the AWS account, this can be a hard requirement that no third-party tool satisfies.
AgentCore itself supports routing telemetry to third-party backends. AWS officially documents Langfuse integration, and Dynatrace and Elastic have built their own connectors. The OTEL-native design means you are not locked in.
Verdict
CloudWatch’s native OTLP support, combined with Pydantic AI’s built-in instrumentation and a lightweight SigV4 signing library, makes a viable agent observability stack with minimal setup. One line of instrumentation code, a setup_otel() function, and you have traces flowing to CloudWatch.
I would recommend this stack for teams that are already on AWS and want agent observability without onboarding another vendor. The compliance story is strong: telemetry stays in your account, IAM handles auth, and you get infrastructure and agent metrics in one place. The April 2026 native OTLP endpoint is a real step forward, eliminating the collector sidecar that previously added complexity.
Worth setting up now while the preview is free. The OTel foundation is the right bet regardless of where you land on different observability platforms.